
Development
Using Caching to Speed up Large Data Returns by 1000x

Mika Kalathil
August 23rd 2022
One of the issues we can encounter when building large systems, is the need to return large items of data, this can be anywhere from 300kb to a few megabytes. Of course directly serving this as a string isn’t really an issue, but the constant decoding/encoding to and from JSON will be, as well as all the overhead of moving through parts of our system that has to deal with the data set.
Baseline Test Project
To test this out we’ve setup a test project which is just a simple barebones Phoenix application.
We’re going to test several returns which range from 100 bytes all the way to 100mb including some dummy large items we might encounter in the wild.
For our project this we’ve gone ahead and modified our router.ex to look like this:
defmodule RequestCacheTestWeb.Router do
  use RequestCacheTestWeb, :router

  pipeline :api do
    plug :accepts, ["json"]
  end

  scope "/api", RequestCacheTestWeb do
    pipe_through :api

    get "/100-bytes", TestController, :test_100b
    get "/10-kb", TestController, :test_10kb
    get "/100-kb", TestController, :test_100kb
    get "/10-mb", TestController, :test_10mb
    get "/100-mb", TestController, :test_100mb
    get "/large-item", TestController, :test_large
    get "/large-items", TestController, :test_larges
  end
end
We’ll now create the dummy data and setup our controller at test_controller.ex:
defmodule RequestCacheTestWeb.TestController do
  use RequestCacheTestWeb, :controller
end
Because this is just a test benchmark project and not a real project, we’re going to get the data as close to the controller as possible and load it into module attributes so that it’s inlined by the compiler and there’s no cost to reading the data from anywhere:
defmodule RequestCacheTestWeb.TestController do
  ...

  IO.puts "Setup items for testing..."

  @item_100_bytes Map.new(1..25, fn i ->
    {i, Enum.random(?a..?z)}
  end)

  IO.puts "100b: #{@item_100_bytes |> :erlang.term_to_binary |> byte_size}"

  @item_10_kb Map.new(1..1750, fn i ->
    {i, Enum.random(?a..?z)}
  end)

  IO.puts "10kb: #{@item_10_kb |> :erlang.term_to_binary |> byte_size}"

  @item_100_kb Map.new(1..15_000, fn i ->
    {i, Enum.random(?a..?z)}
  end)

  IO.puts "100kb: #{@item_100_kb |> :erlang.term_to_binary |> byte_size}"

  @item_10_mb Map.new(1..1_500_000, fn i ->
    {i, Enum.random(?a..?z)}
  end)

  IO.puts "10mb: #{@item_10_mb |> :erlang.term_to_binary |> byte_size}"

  @item_plus_100_mb Map.new(1..15_000_000, fn i ->
    {i, Enum.random(?a..?z)}
  end)

  IO.puts "100mb: #{@item_plus_100_mb |> :erlang.term_to_binary |> byte_size}"

  @large_item Jason.decode!(File.read!("./large-item.json"))

  IO.puts "large_item: #{@large_item |> :erlang.term_to_binary |> byte_size}"

  @large_items Map.new(1..100, fn i ->
    {i, @large_item}
  end)

  IO.puts "large_items: #{@large_items |> :erlang.term_to_binary |> byte_size}"
end
Now that we have our data, let’s setup our controller functions to match our router and return our data:
defmodule RequestCacheTestWeb.TestController do
  ...

  def test_100b(conn, _) do
    conn
      |> put_status(:ok)
      |> json(@item_100_bytes)
  end

  def test_10kb(conn, _) do
    conn
      |> put_status(:ok)
      |> json(@item_10_kb)
  end

  def test_100kb(conn, _) do
    conn
      |> put_status(:ok)
      |> json(@item_100_kb)
  end

  def test_10mb(conn, _) do
    conn
      |> put_status(:ok)
      |> json(@item_10_mb)
  end

  def test_100mb(conn, _) do
    conn
      |> put_status(:ok)
      |> json(@item_plus_100_mb)
  end

  def test_large(conn, _) do
    conn
      |> put_status(:ok)
      |> json(@large_item)
  end

  def test_larges(conn, _) do
    conn
      |> put_status(:ok)
      |> json(@large_items)
  end
end
We can start our project and see the output is the following:
Erlang/OTP 24 [erts-12.2.1] [source] [64-bit] [smp:10:10] [ds:10:10:10] [async-threads:1] [dtrace]

Compiling 9 files (.ex)
Setup items for testing...
100b: 106             (106B)
10kb: 11491           (11.49KB)
100kb: 104241         (101.79KB)
10mb: 10499241        (10.49MB)
100mb: 104999241      (104.99MB)
large_item: 691128    (0.69MB)
large_items: 69112906 (69.11MB large_item x 100)
Now that we have our test data setup and the ability to query it, let’s test it out
Benchmarking
To benchmark, we’re going to use this simple livebook notepad, which will allow us to do some setup and test our data using benchee
First, we’ll add our setup block:
Mix.install [:jason, :finch, :benchee, :benchee_html]

{:ok, _} = Finch.start_link(name: BenchMarkFinch)

get_url = fn path ->
  :get
    |> Finch.build(Path.join("http://localhost:4000", path))
    |> Finch.request(BenchMarkFinch)
end
Next let’s setup our test which will just call each route:
inputs = %{
  "100 Bytes" => "100-bytes",
  "10 KB" => "10-kb",
  "100 KB" => "100-kb",
  "10 MB" => "10-mb",
  "100 MB" => "100-mb",
  "Large Item" => "large-item",
  "Large Items (Multiple)" => "large-items"
}

inputs = Map.new(inputs, fn {name, url} ->
  {name, fn -> get_url.(url) end}
end)
Next we can run our benchmark:
Benchee.run(
  inputs,
  warmup: 10,
  time: 30,
  formatters: [
    Benchee.Formatters.HTML,
    Benchee.Formatters.Console
  ]
)
After finishing this gives us some nice data:
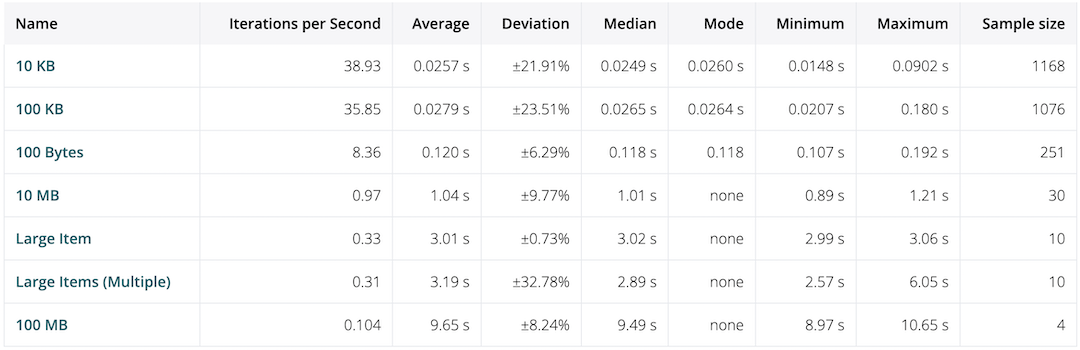
Looking at that our smaller payloads under 10MB return in ~1 second or less, once we get up to our large items however which ar 0.69mb and ~69mb for our multiples, our response times are terrible, spanning 3 seconds or more, at worse 100MB is nearly 10 seconds!!
From what we can see here, our response times get longer the larger our item is, which makes sense, we have to do a complex JSON encoding every time we want to return our data. To solve this we can try adding some form of caching.
Adding Request Caching
We can think about request caching in a few ways, one way is we can add some caching to our controller, but this will still have to go through JSON decoding to get the request parameters, then JSON encoding to encode our request to json every time.
A better idea would be to return our encoded JSON when we detect the item is in our cache, that way we don’t have to spend time re-encoding our JSON. To implement this, we have a couple options:
-
We could implement a plug in the
router.ex -
We could implement a plug in our
endpoint.ex
When we look at our endpoint.ex, we can see that at the bottom we’re using plug RequestCacheTestWeb.Router which means we’re ultimately just calling our Phoenix router at the bottom of our endpoint.ex. This means if we placed our request cache plug in the router.ex, all our previous plugs would still have to run first. Instead if we place our plug in the endpoint.ex, we can use &Plug.Conn.halt/1 to stop all other plugs from running! This should lead us to a really good response time resolution since we can return a cached results fairly quickly with little overhead.
To encapsulate this feature, I’ve created a library called request_cache_plug, this little library only does one thing, and that’s cache your request results and returns them the next time, we can do this for both Absinthe Resolvers in GraphQL or Phoenix Controller functions. To add this library in all we need to do is add it to our deps and setup our new plug inside our endpoint.ex:
plug Plug.Telemetry, event_prefix: [:phoenix, :endpoint]

# Ideally it should be after Telemetry, but before we try to parse the request
plug RequestCache.Plug

plug Plug.Parsers,
  parsers: [:urlencoded, :multipart, :json],
  pass: ["*/*"]
Next we can go and update all our controllers and add the following call to each:
RequestCache.store(conn, :timer.minutes(60))
This will read our query params and url, and try to cache the results if it’s seen the same pair before. To implement this, we can change our functions to look like this in our test_controller.ex:
def test_100b(conn, _) do
  conn
    |> RequestCache.store(:timer.minutes(60))
    |> put_status(:ok)
    |> json(@item_100_bytes)
end
We also need to start the cache we’ll be using in our application.ex, in this case we’re just going to use the default implementation which is con_cache, but we also have the option to configure the cache module globablly as well as in each controller/resolver function.
To set up our cache storage module, we can change our application.ex like so:
children = [
  RequestCacheTestWeb.Telemetry,
  {Phoenix.PubSub, name: RequestCacheTest.PubSub},
  RequestCacheTestWeb.Endpoint,

  RequestCache.ConCacheStore # Newly added
]
Benchmarking Revisited
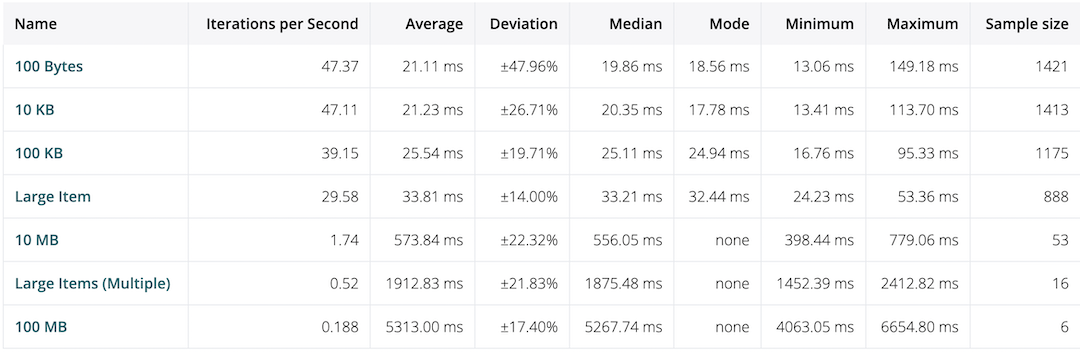
Now that our code is all setup, let’s go back to our livebook notepad and re-run everything and check our new results:
Before and After
| Name | Before Avg/Max | After Avg/Max |
| 10 KB | 28ms/90ms | 21ms/113ms |
| 100 KB | 27ms/180ms | 25ms/95ms |
| 10 MB | 1.04s/1.21s | 573ms/779ms |
| Large Item (0.69MB) | 3.01s/3.06s | 33ms/53ms |
| Large Items (Multiple 69MB) | 3.19s/6.05s | 1.9s/2.4s |
| 100 MB | 9.65s/10.65s | 5.3s/6.6s |
This is great, we’ve lowered most of our response times by 50% without doing anything other than adding a library, in the case of our Large Item which is a deeply nested large map, our response time dropped by 100x!!!!
However, one thing this doesn’t account for, is the time Benchee takes to process the incoming binary payload, to eliminate this factor we can look at the logs of our phoenix response times and we’ll see an even bigger difference
[info] GET /100-mb
[debug] Processing with RequestCacheTestWeb.TestController.test_100mb/2
  Parameters: %{}
  Pipelines: [:api]
[info] Sent 200 in 12124ms
[info] GET /100-mb
[info] Sent 200 in 1149ms
[info] GET /100-mb
[info] Sent 200 in 1111ms
Here we can see our first request did all the work, and every request after that is over 10x faster just by purley avoiding JSON encoding.
If we look at the requests without this cache, our first result is faster, but we get nearly the same time result, over and over again instead of it dropping down:
[info] GET /100-mb
[debug] Processing with RequestCacheTestWeb.TestController.test_100mb/2
  Parameters: %{}
  Pipelines: [:api]
[info] Sent 200 in 6083ms
[info] GET /100-mb
[debug] Processing with RequestCacheTestWeb.TestController.test_100mb/2
  Parameters: %{}
  Pipelines: [:api]
[info] Sent 200 in 6033ms
[info] GET /100-mb
[debug] Processing with RequestCacheTestWeb.TestController.test_100mb/2
  Parameters: %{}
  Pipelines: [:api]
[info] Sent 200 in 6080ms
Final Notes
Using request caching can speed up our API by a ton, in this example we’ve seen how we can speed up a REST request, which already has very little overhead. In some cases like with Absinthe, our overhead is even larger and Absinthe’s pre-walk of the return data before encoding can take upwards of 200ms alone for objects larger than 15MB. Using a strategy like this, where we circumvent any plugs we don’t want running when we have a cached result, we can bring our request time back down into a reasonable range.
At Blitz.gg this library was successfuly used to bring response times down from 400ms for large objects, which were being walked (slowly) by absinthe as well as parsed into JSON, to sub 400μs which is a 1000x speedup!! This is a very real case that can happen when having nested graphs to walk and big payloads that need to be sent between Postgres and our Elixir app.
Finally where we decide to put our plugs matter, especially in the case of caching, we should all be careful to make sure we’re aware of our request lifecycle, and choose the optimal spot to put our plug in. For example if we have an authorized route, we may not want this form of caching if it’s say authorization at a GQL layer since this will return data even if the user is no longer authorized.
Specs for my computer
I ran the benchmarks on the following specs:
- Operating System: macOS
- CPU Information: Apple M1 Max
- Number of Available Cores: 10
- Available memory: 64 GB
- Elixir: 1.13.3
- Erlang: 24.2.2